Share
Author
George Anderson
Share
Mobile B2B eCommerce Growth – Real Data
If I had a penny for every article I’ve seen about the importance of mobile in B2B e-commerce, I’d be rich. In fact, I’ve seen so many of these articles, I’m sick of the topic. But that’s because I never see any data to back up the platitudes. How would I dare add another article on that topic to the internet?
Because I have the data. And it’s amazing.
Mobile usage is skyrocketing in B2B e-commerce—especially in the manufacturing industry. But don’t take my word for it. I’ll let these 4 stats speak for themselves. This is real data taken from a subset of manufacturers who use Corevist for SAP e-commerce. We’ll look at July 2017 to present.
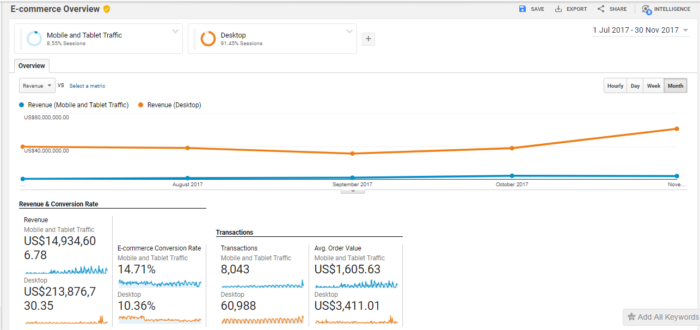
1. Growth in Mobile/Tablet Monthly Revenue
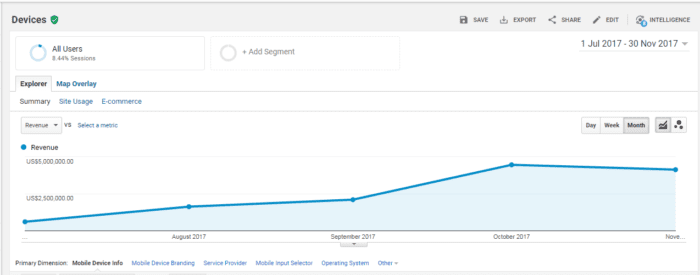
For this subset of Corevist clients, mobile revenue has skyrocketed since July.
- 1 July – 31 July 2017, mobile revenue was $608,363.34.
- 1 Nov – 30 Nov 2017, mobile revenue was $4,125,175.82.
- 578% increase in mobile/tablet revenue.
It’s useful to compare this stat to mobile/tablet sessions for the same period. Let’s take a look.
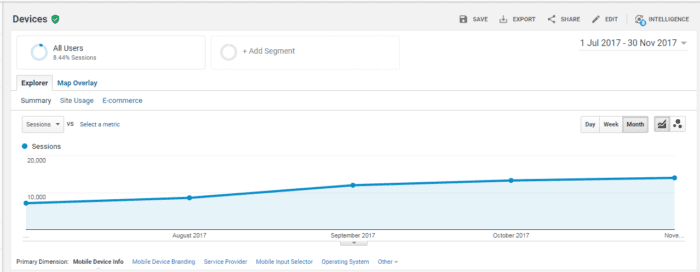
- 1 July – 31 July 2017, 7,149 mobile sessions.
- 1 Nov – 30 Nov 2017, 14,007 mobile sessions.
- 96% increase in mobile/tablet sessions.
The difference between session growth rate and revenue growth rate is startling. Wouldn’t you expect these two stats to scale in a linear fashion? But that’s not what we see. Mobile revenue grew five times as fast as sessions. At a high level, this indicates that the customer base sampled in this data is realizing just how convenient mobile B2B e-commerce is. This reflects the larger shift toward mobile that we’re seeing in the industry.
What does this mean? If revenue is growing at a higher rate than sessions, conversion rate must be increasing. Which leads us to…
2. Conversion Rate on Mobile/Tablet Is Higher Than Overall Conversion Rate
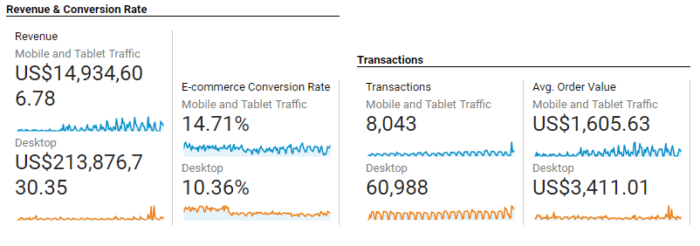
From July 1 to November 30 2017, the mobile/tablet conversion rate was higher than desktop conversion rate. However, it’s interesting to note that average order value is lower on mobile/tablet as compared to desktop. What does this mean? It could indicate several things. For example, users may place quick orders for commoditized products on mobile, while using desktop for larger, more complex, or more expensive products. For B2B manufacturers selling lower-cost and/or commoditized products, that means a convenient, mobile-ready store is crucial to capturing revenue.
That said—take the lower average order value with a grain of salt, because…
3. Average Order Value for Mobile/Tablet Is Up 72%
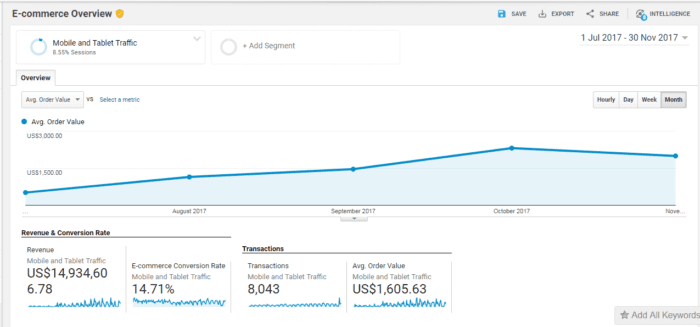
Over that same period, average order value has jumped 72% on mobile/tablet. Are customers using mobile more? Absolutely. Do we expect average order value to continue to climb? Yes! Whether it will meet or exceed average order value on desktop remains to be seen.
To put this in context, let’s look at the growth in average order value on desktop over the same period:
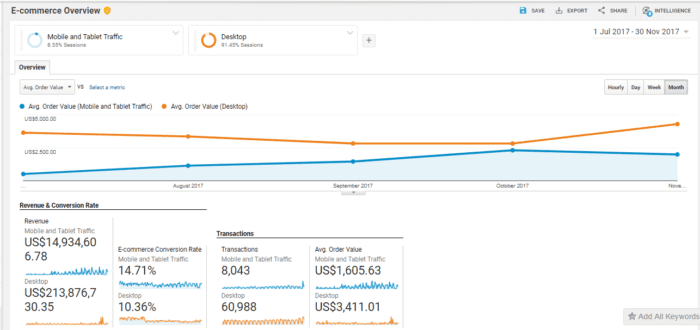
Average order value on desktop shows a net increase of 18% over the same period, only ¼ the growth rate of average order value on mobile.
The takeaway: more and more B2B customers are placing orders from their phones. For some companies, mobile-friendly B2B e-commerce is a must. In other industries, it may not be as important.
For example, some of our clients barely use mobile. Their products and distribution strategy put them in front of corporate buyers–people who sit behind desks all day. Other companies have products and distribution channels that put them in front of mobile B2B buyers. These clients absolutely need a mobile-friendly e-commerce store.
Which is it for you? The key is to know your customer, including where and how they want to buy.
4. Mobile/Tablet Revenue Is Growing as a Percentage of Overall Revenue
Among all the stats we’ve covered, this is my personal favorite. Mobile revenue as a percentage of overall revenue is growing fast.
- 1 July – 31 July 2017, mobile revenue was 1.9% of overall revenue.
- 1 Oct – 31 Oct 2017, mobile revenue was 10.5% of overall revenue. Though the proportion fell in November, it did not fall below the original proportion.
- 1 Nov – 30 Nov 2017, mobile revenue was 6.3% of overall revenue.
- Between 1 July and 30 Nov 2017, mobile as a proportion of overall revenue increased 232%.
Takeaways
What does the growth in mobile B2B e-commerce mean for manufacturers and distributors? It means there’s no better time than the present to launch mobile friendly e-commerce. For those B2B companies that already have an e-commerce solution, the growth in mobile can mean many things, depending on where your company is at in the e-commerce journey.
What does the growth in mobile mean for you? Consider these factors:
- If you have historically neglected mobile optimization and mobile marketing, it may be time to reevaluate the data and see what your customer base prefers.
- If you sell commoditized products, mobile is especially important. It allows B2B buyers to make routine, “low-thought” B2B purchases on the go.
- If your e-commerce store isn’t mobile friendly, you should consider engaging a responsive e-commerce solution.
If you’re considering an SAP B2B e-commerce solution, the good news is that Corevist is desktop-friendly and mobile-friendly out of the box. Our platform is responsive and ready to roll out to your on-the-go customers.