Share
Author
George Anderson
Share
Editor’s note: Originally published April 25, 2018. Updated July 21, 2021.
Whether you’re launching B2B eCommerce to grow revenue, increase efficiency, or both, you need to define your goals and measure your performance against them. But what should you actually measure? And how do you quantify it?
In this article, we’ll give you 5 ideas for healthy goals to pursue with B2B eCommerce. We’ll also tell you where to get the related metrics (or how to calculate them).
Let’s dive in!
Goal 1: Drive more customers to adopt B2B eCommerce
This is the most common starting point for manufacturers launching B2B eCommerce. Unlike a B2C business, you’re not necessarily trying to attract new users. Rather, you have an established customer base, and you’re trying to move them to B2B eCommerce, away from phone, fax and email ordering.
So how do you track customer adoption?
Metric: User registration relative to overall customer base
Measuring adoption among existing customers is fairly straightforward. Take the number of ecommerce accounts you’ve signed up and divide it by your existing customer base (your total list of sold-tos from SAP).
- (587 ecommerce signups) / (1000 total customers) = 58.7% adoption rate

NEW Report:
Growth Strategies for Manufacturers
Every manufacturer needs to grow in the digital age. Here’s the ultimate guide to growth strategies for manufacturers. Read now.
Goal 2: Reduce calls to customer service for routine order status inquiries
Manufacturers commonly launch B2B eCommerce to increase efficiency in their OTC (order-to-cash) cycle. This makes sense, as self-service ordering and account management is far more efficient than manual interaction with customers.
But how do you quantify these gains?
Metric: Status checks in the portal vs. customer service inquiries
With Google Analytics set up to track order status checks in your B2B portal, you can quantify the number of inquiries occurring through self-service. If you track the number of phone and email inquiries to customer service for the same purpose, you can compare the growth in self-service status checks vs. the decline in calls and emails. This will give you a quantified picture of your transition to self-service.
Goal 3: Figure out which products to back with marketing budget in which regions
Every decision you make in B2B eCommerce should be data-driven. That’s especially true if you’re determining which products should get a push with marketing dollars.
While there are many ways to determine this, one method is to look at bestselling products in a given region and put marketing budget behind those products.
Metric: Bestselling product by region
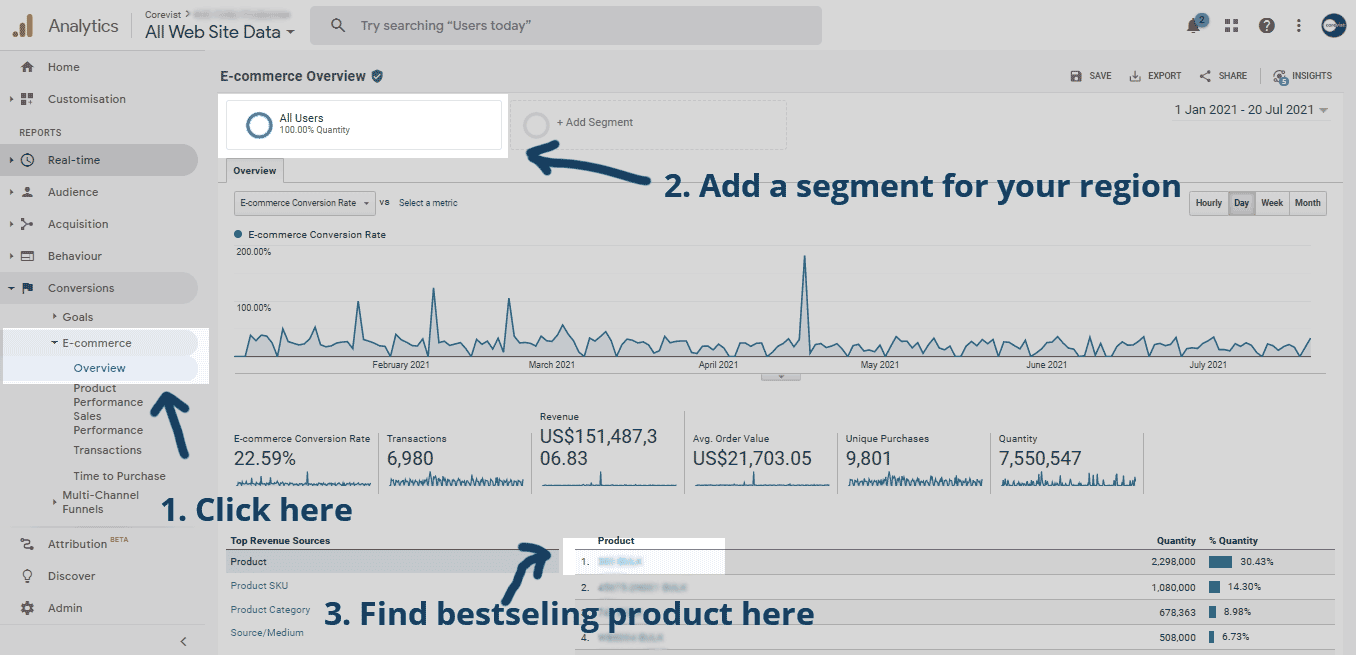
If your B2B eCommerce solution comes with Google Analytics set up (as the Corevist Platform does), this is easy to find. Just go to E-commerce > Product Performance. Click on a product, then apply a segment for the region you want to analyze. If you haven’t created any segments, here’s a quick tutorial on how to do it.
Goal 4: Equip sales and customer service to prioritize your highest-value customers
In B2B, not every customer is created equal. Some will buy from you once or twice a year. Others will place large orders frequently.
You’ve heard of the 80/20 rule—it definitely holds true in B2B eCommerce. Often, 20% of your ecommerce customers account for 80% of your revenue. Your sales and customer service teams need to prioritize and nurture those accounts on an ongoing basis.
So how do you pinpoint your highest-value B2B eCommerce customers?
Metric: Lifetime value of eCommerce customer
This metric tells you how much a single customer has generated for you over the life of their relationship with you. In other words, it’s all their B2B eCommerce orders totaled up. This metric helps you prioritize customers because it focuses strictly on revenue.
Goal 5: Determine which traffic sources should get marketing budget
There are many paths to your B2B eCommerce website. Organic SEO (Google search), social media, email campaigns, and referral links can all send traffic to your site.
But not all traffic is created equal. In fact, many traffic sources are low- to no-value. If you’re trying to increase conversion rate on your site, you need to consider which traffic sources are the highest value so you can focus your marketing efforts there.
Metric: Conversion rate by traffic source
Conversion rate is simply the percentage of visits that completed a B2B eCommerce purchase. In Google Analytics, you can break this out by traffic source to see which source has the highest conversion rate.
NEW Report:
Growth Strategies for Manufacturers
Every manufacturer needs to grow in the digital age. Here’s the ultimate guide to growth strategies for manufacturers. Read now.