Share
Author
George Anderson
Share
B2B eCommerce Growth Metrics
At Corevist, our goal is to make B2B eCommerce accessible to all manufacturers running SAP ERP. A key part of that is giving manufacturers the tools they need to measure eCommerce success. To that end, every Corevist Commerce implementation includes Google Analytics.
Of course, Google Analytics is only as useful as your goals are quantified. You can’t measure success if you haven’t defined a quantitative goal—which is why we encourage all manufacturers to set quantitative goals around their web channel. These goals should support the main business driver behind the Corevist Commerce implementation. Usually, that business driver falls into one of two broad buckets:
- Grow revenue through eCommerce
- Increase efficiency
- Move existing business off phone/fax/email (and onto eCommerce)
In this post, we’ll examine 4 key metrics in Google Analytics which you should track to support revenue growth goals. In the next post, we give you metrics to support goals around increasing operational efficiency thru B2B eCommerce.
Key Metric 1: Revenue
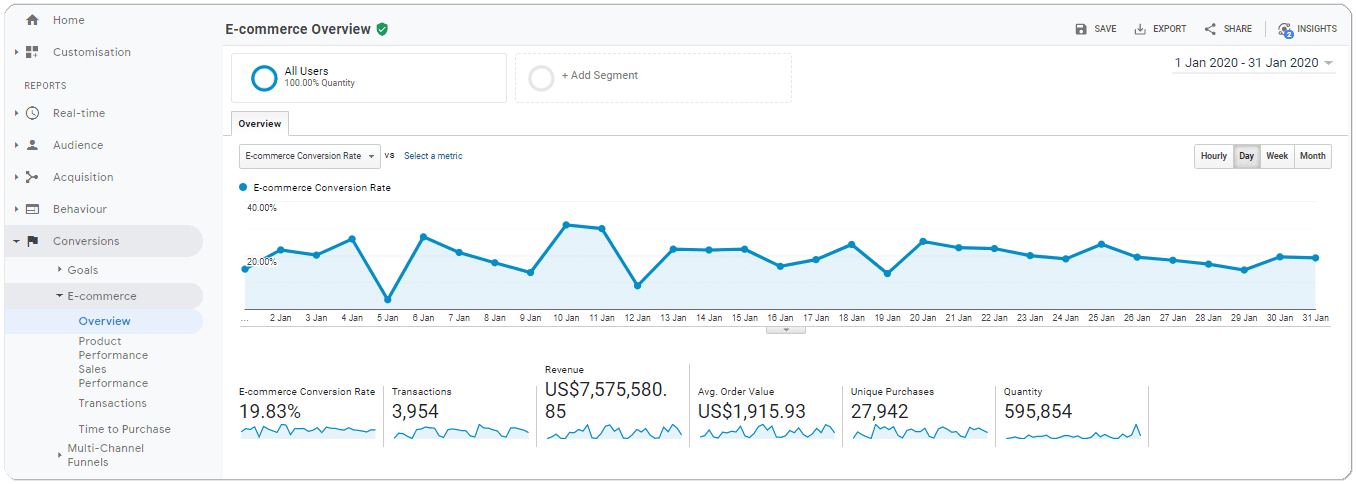
Find it: Conversions > E-commerce > Overview
It’s fairly obvious: If your goal is to grow revenue through B2B eCommerce, you’ll want to monitor the eCommerce portion of that revenue in Google Analytics.
Of course, you need to place eCommerce revenue growth in the context of your overall revenue composition. If your eCommerce revenue is trending up while total revenue is flat, you may be moving existing customers to eCommerce, but not acquiring new business. Moving existing buyers off phone/fax/email onto eCommerce offers plenty of benefits, but it doesn’t necessarily equate with overall revenue growth.
Refine it: View Revenue by Source/Medium
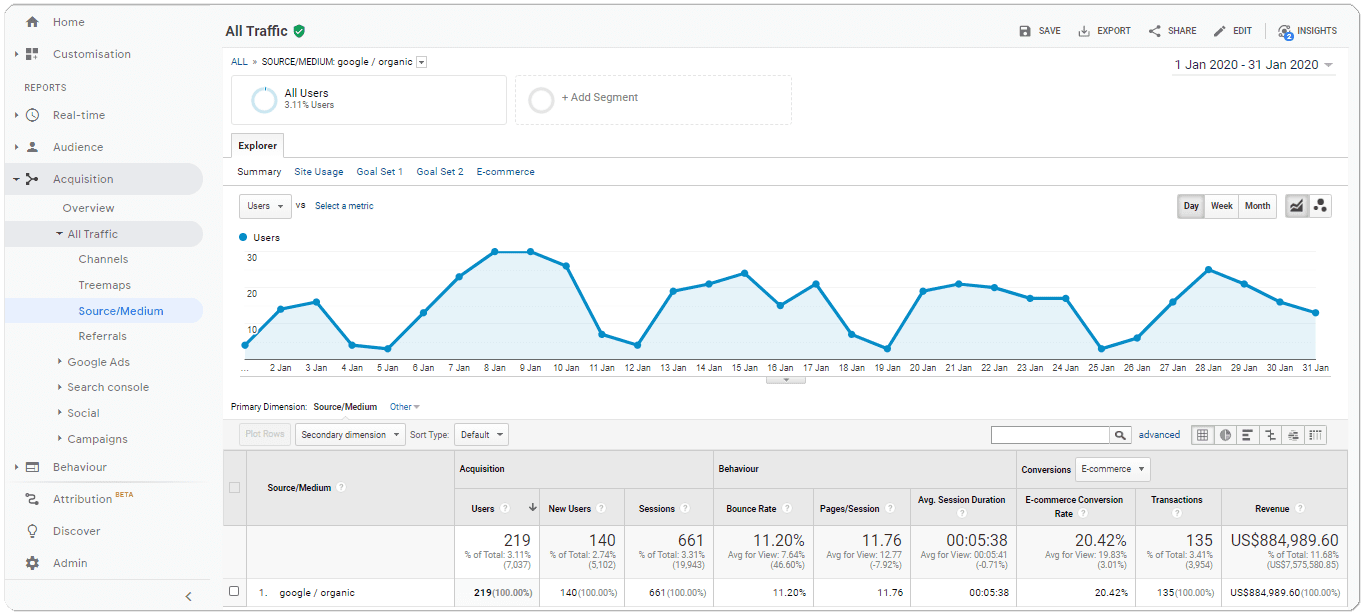
Acquisition > All Traffic > Source/Medium. OPTIONAL: Secondary Dimension > Landing Page
There are many ways to refine your picture of eCommerce revenue. Say you want to determine which Sources (e.g. organic, direct, social, etc.) produce the most revenue. This information can help you decide where to focus your marketing efforts as you work to drive revenue growth. For example, you might find:
- Your regional corporate websites are sending the lion’s share of traffic to your eCommerce site, via Referral. Can you increase this traffic by making the link to the eCommerce site more prominent in the visual hierarchy of the regional corporate site?
- You are trying to gain net new customers by increasing your footprint in Google Search, yet Organic traffic and revenue are not growing. Is there a problem with performance in Google SERPs (search engine results pages) vs. your competitors’ eCommerce sites?
- You are not getting much revenue from Social, despite ongoing paid campaigns on relevant social platforms. Why doesn’t your social audience find value in the campaigns? There are many attributes to evaluate here—messaging, value proposition, targeting, and more.
Key Metric 2: Average Order Value
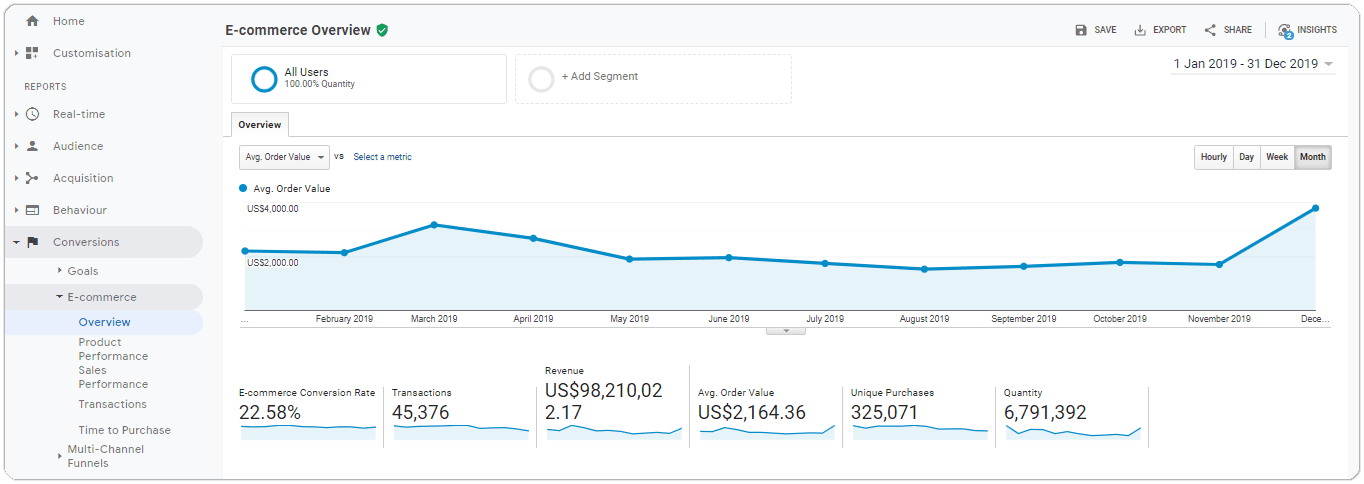
Find it: Conversions > E-commerce > Overview
AOV (average order value) is a critical metric for any eCommerce growth plan. Since it’s far more expensive to acquire a new customer than it is to provide more value to an existing one, growing AOV from each existing customer is a key component of any growth strategy.
Here’s where product catalogs, rich content, intelligent search, and cross-sell/upsell come into play. B2B eCommerce offers a unique opportunity to increase your value to the buyer in every transaction. In particular, cross-sell/upsell capabilities can introduce your customers to related products which they might have purchased from a different supplier.
Refine it: Try adding a segment for Country
Conversions > E-commerce > Overview; Add Segment > NEW SEGMENT > Demographics > Location > SPECIFY
Which geographies are trending up in AOV? Which ones are trending down? This granular data can give you insight into your cross-selling/upselling strategy in each region. You can use it to refine your offers and tailor them to regional preferences.
Key Metric 3: Change in eCommerce performance among new users
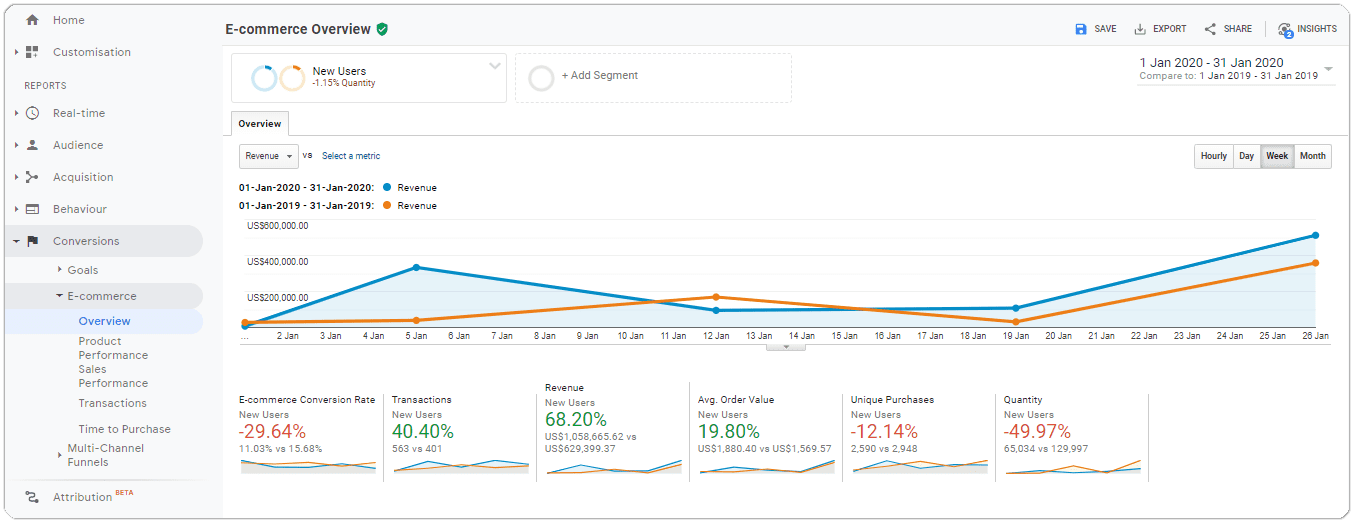
Find it: Conversions > E-commerce > Overview; Add Segment > New Users; Then compare date ranges
This metric will give you “fuzzy” visibility into the performance of your site among new users. We say “fuzzy” because, as Hotjar explains, not all “new users” in Google Analytics are actually new. Google labels a user as “new” if they don’t have a tracking cookie on their device. A user who deletes all their cookies before returning to your site, or who visits it from a different device, will count as a new user.
So how accurate is Google’s “new user” segment? It’s hard to say. But for manufacturers whose buyers typically make purchases at work, from the same corporate desktop machine with cookies enabled (and browsing data rarely cleared), there’s a good chance “new users” will be fairly accurate.
Generally speaking, change in eCommerce performance among new users can give you a rough idea of whether your footprint is growing or stabilizing. If your eCommerce goals include growing revenue, this metric can help you understand how your increasing footprint is supporting that goal (or not)—and where your change in revenue is coming from.
Key Metric 4: Change in eCommerce conversion rate
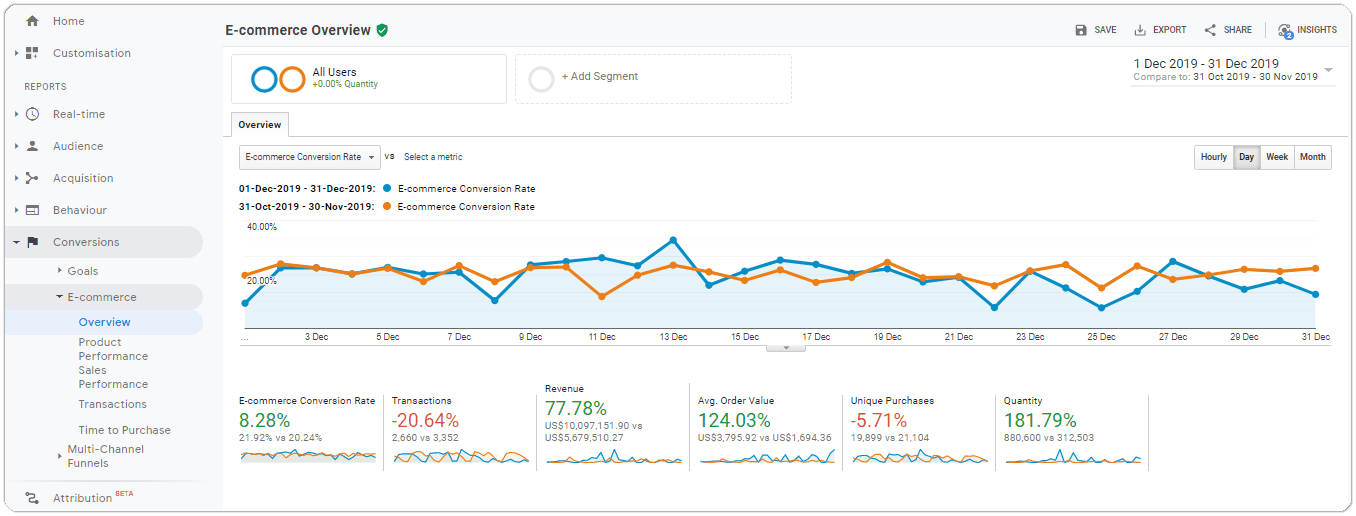
Find it: Conversions > E-commerce > Overview; Compare date ranges
Simply put, your eCommerce conversion rate is the percentage of sessions which led to a transaction. Since our clients typically use Corevist Commerce to sell to channel partners, rather than to consumers, they often achieve higher conversion rates than B2C eCommerce businesses.
Refine it: Track change in Sessions and change in Transactions, too
Conversions > E-commerce > Overview; Compare date ranges
Tracking change in conversion rate helps you identify areas of improvement for hitting revenue growth goals. However, you’ll need to go deeper to understand whether a drop in conversion rate indicates a problem that needs fixing, or a healthy expansion of how customers are using the portal.
Corevist clients often launch eCommerce to grow revenue—but also to transition customer service and account management to a self-service web portal. The thinking goes like this: Not only do customers want to buy online, they also want to manage their accounts online rather than calling or emailing Customer Service, so the portal should support those activities.
If you’re promoting your web channel to customers as an account management portal in addition to an ordering portal, then a drop in conversion rates can’t tell you much about the overall health of the portal—until you look at change in Sessions and change in Transactions, too.
- Example 1: Conversion rate has dropped. Sessions are stable, but transactions are down. This usually indicates a problem in user experience or value proposition(s). Users are on the site, but they’re not buying like they used to. Investigation is required.
- Example 2: Conversion rate has dropped. Transactions are stable, revenue is relatively stable, and sessions are up. If your eCommerce portal includes account management functionality like order status/tracking, invoice payments, and document reprints, you’ll want to examine growth in those actions (found under Conversions > Goals > Overview in the standard Corevist Commerce implementation of Google Analytics). If you see growth here, it generally indicates that users are coming to the web channel for more than just transactions—they’re doing self-service account management, too. All of that bodes well for the stickiness of your web channel.
The Takeaway: Define your quantitative growth goals (and track metrics that support them)
When it comes to Google Analytics, the sky’s the limit as far as eCommerce data. The key is to define your quantitative growth goals, then use refined data in Google Analytics to see how you’re tracking to those goals. Choose a few key metrics that define the performance you care about, measure regularly, and use that intelligence to adapt.
Moving forward: FREE case study
Want to see growth-oriented eCommerce in real life? Download this case study on a Fortune 1000 manufacturer who chose Corevist. This organization had an audacious goal—replatform onto Corevist, transition $100M in digital revenue there, and then grow it to $500M. Learn how Corevist Commerce delivered early growth of 204%, to $76M/quarter and counting.
[want_more title=”Learn more” subtitle=”FREE Case study: Fortune 1000 Manufacturer” description=”Learn how this organization launched ecommerce and grew revenue 204%, to $76M/quarter.” button_text=”Download Now” button_link=”https://www.corevist.com/fortune-1000-manufacturer/” button_class=”btn btn-primary fortune-1000″ title2=”See it for yourself” subtitle2=”Talk to us” description2=”Curious what Corevist Commerce can do for you? Let us show you a personalized demo. You’ll see ecommerce with real-time SAP data.” button_text2=”Schedule Demo” button_link2=”https://www.corevist.com/demo/” button_class2=”demo-popup”]