Share
Author
Tomas Maza
Share
In the world of SAP B2B e-commerce, we don’t often see gigantic orders. We see ten line items, thirty, maybe even fifty–these are all typical. Our app handles them day-in, day-out for every single client.
But what about an order with 500 line items? Can a customer really place that gigantic order through Corevist Commerce?
Yes! But our team had to work hard to design a solution. Here’s how we did it.
NOTE: This post is Part 1 in a 2-part series. Subscribe to the Corevist blog to get Part 2 when it comes out.
The problem: Massive orders (with EDI off the table)
Usually, an order with hundreds of line items is best left to EDI (electronic data interchange). But many large national distributors and wholesalers can’t justify the cost of building an EDI solution. In fact, the Corevist team recently encountered this exact problem. One of our clients needed to take 500-line orders, but EDI was not an option. What’s a midmarket B2B firm to do?
At Corevist, we’re trusted advisors to our clients. When a client asks us for help with a unique problem, we don’t like to say, “Sorry–it can’t be done.” We got to thinking: why not break up a gigantic order into smaller pieces and process them in parallel to save time? This would create a better user experience (less lag time). The only question was what order size would perform the fastest at a line-item level.
First step: Determine optimal order size
You might think that SAP response times scale linearly with order size. Actually, that’s not the case at all. (See our real data below.) A real-time integration to SAP requires a complex architecture. Economies of scale come into play in ways you might not expect.
To start creating a solution for massive orders, our first step was to read the data and discover patterns in response time that help us pinpoint optimal order size.
Unique challenge: Working with a variety of SAP systems (and response times)
If we’ve learned one thing in 10 years of SAP e-commerce, it’s this: every client’s SAP system is different. SAP configurations are as varied as the companies and industries we serve. What works for one company may not work for another.
It gets even more complicated when you add legacy SAP configuration to the mix. We often see SAP systems that have layer upon layer of unnecessary logic baked in. This happens when the system has survived many ad hoc tweaks over the years.
Sometimes, our clients actually need to keep this complexity. But there’s usually a better way. Our challenge is to analyze the complexity, communicate with the client about their needs, and make recommendations on how to simplify (when possible)—while using real customer response time data to drive our decisions as we improve our app.
Using real data on response times
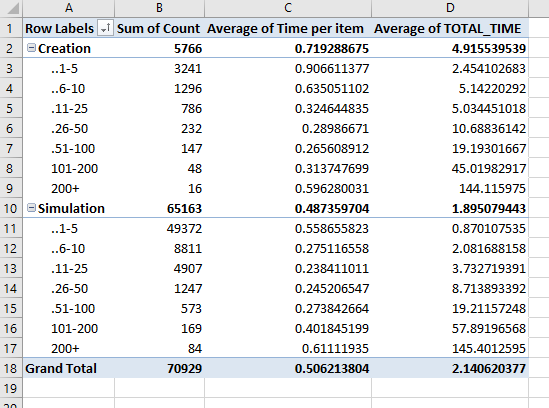
I’d like to show you real customer data on response times for our RFCs (remote function calls to SAP). This data is straight from our client’s store. Column A shows number of line items per order, while Column C shows average response time per line item. The top section of the spreadsheet shows order creation response times, while the bottom section shows response times for order simulation in SAP.
For the sake of clarity, let’s look at this in graph form. The X axis represents average response time per line item, while the Y access represents line items per order.
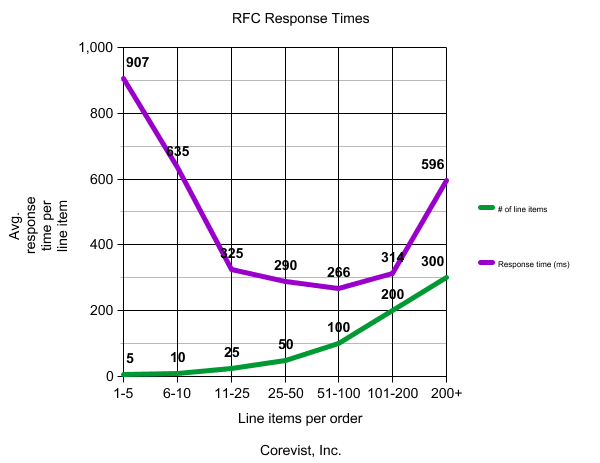
Clearly, there’s a sweet spot here. Average processing time per line item is lowest in the range of 11-200 line items per order, with 51-100 being the optimal order size (average of 0.266 seconds per line item).
Why the U-shaped curve?
Great question. We know that an economy of scale comes into play as you move from left to right across the graph–to a point. Some overhead in SAP processing is unavoidable due to reading of master data for the customers and partners (as well as the configuration of the business rules that process the order). This processing overhead doesn’t change, regardless of the number of line items in the order. That’s why smaller orders see such large average response times per line item.
However, the average response time does begin to scale back up with 100+ line items per order. Why is this? Because SAP’s pricing engine will distribute header calculations to the items and roll up totals into the header. In some cases, this means that the pricing must be determined for all line items, for each line item. This creates an almost exponential cost in processing large orders. While a customer service rep won’t usually feel this processing lag when adding one line item at a time, it certainly adds up when all line items are entered at once.
In a moment, I’ll tell you what we’re doing with this data. But first, there’s one more piece of the equation that I need to mention.
What role does the Corevist app play in response time?
Order response time is almost entirely a function of SAP system performance. Our real-time web services contribute almost no added time to order processing.
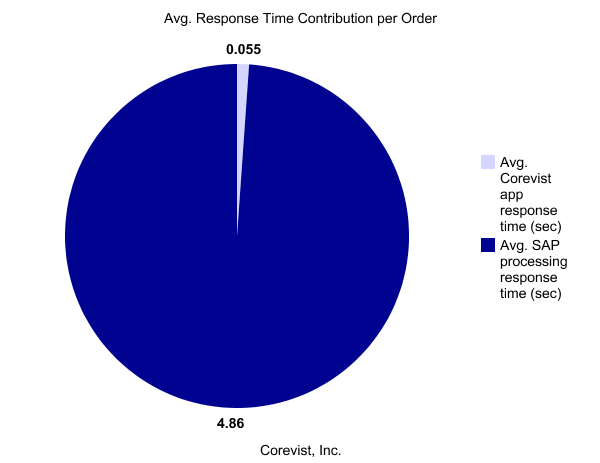
- The Corevist app averages 0.055 seconds per RFC call to send queries between SAP and the e-commerce store.
- Average SAP processing time is 0.664 seconds per line item.
In the same data set for this client, across orders of all sizes, the Corevist app processed 70,929 total function calls with an average total response time (including SAP system processing) of 2.14 seconds per order. These function calls processed data such as availability checks, price checks, permission checks, and much more.
In other words, Corevist’s footprint via web services is tiny.
What we’re doing with the data: Determining optimal order size
We’re conducting tests to find a sweet spot in order size. That means chopping up large orders into smaller orders. When someone enters a 300-line order, we break it up into chunks that will simulate in SAP as fast as possible. After simulation, we bundle everything into one order again and post to SAP. This ensures that things like customer discounts at the order level remain accurate (with no rounding errors).
This data on RFC response time helps us determine the best break point. For example, if we took that 300-line order and created 60 5-item orders, that’s not optimal. Orders with 5 items or less average 0.907 seconds of processing time per line item. But if we run that 300-line order as 12 orders of 25 lines each, we get 0.325 seconds of processing time per line item.
That’s a huge difference. It really adds up.
- 300 line items X 0.907 seconds = 272 seconds (4 minutes, 32 seconds)
- 300 line items X 0.325 seconds = 97 seconds (1 minute, 37 seconds)
As the graph shows, 51-100 line items is the sweet spot. That’s where we’re getting the most bang for our buck in SAP processing value versus processing time. Going forward, we plan to implement new, behind-the-scenes order breakpoints to take advantage of this optimal performance band.
What this means for you
If you’re a Corevist client (or considering the Corevist solution for e-commerce), this is great news. It means your biggest orders will simulate and post to SAP faster than ever. Ultimately, that means satisfied customers—and it makes you easier to do business with.
Moving forward: Case study
Download the case study below to find out how Bell and Howell, a spare parts manufacturer, revived their business with SAP-integrated e-commerce. The new e-commerce site, which posts orders of all sizes to SAP in real time, increased the company’s revenue by $200,000 in the first 60 days of operation.